
Despite already being mentioned already above, it’s worth repeating here: How you model your data is one of the most important factors determining how well Power BI works and, unlike many other BI tools, Power BI is optimized for working with dimensional models and star schemas rather than flat, wide tables. We have seen too many customers skip this important step of building a quality data model within Snowflake. Snowflake also recommends trying to avoid using Power BI features such as the Power Query Editor or creating calculated columns to work around any deficiencies in the way your data is modeled: all of your data modeling work should be done in Snowflake before you do any work in Power BI.”

Before we can talk about modernizing from a legacy Business Intelligence (BI) extract, we need to answer the questions: why are they used? And what are they?
The “why” behind extracts boils down to improved query performance on published dashboards. You can see more details about the “why” for data extracts in Tableau’s own words here, and for Microsoft PowerBI’s Import Mode here. We will term these “extracts” for the remainder of this article.
So what is an extract? Many BI tools offer a concept of data “extracts” – they allow data to be extracted to the tool for further massaging and direct queries, avoiding queries to the underlying database completely. To create an extract, the user runs a live query to the database from the BI tool, as themselves or with a service account. They then save that extracted data in a BI tool that’s tied to a visualization in a dashboard, and share that dashboard pointed to the extract with their dashboard consumers.
BI extracts are an anti-pattern to modern data engineering for two reasons.
Fundamentally, they:
1. Violate security: Extracts severely violate data security standards and guidelines. This article will specifically focus on how they break globally recognized security standards and guidelines across:
- NIST 800-207 Zero Trust Architecture,
- ISO/IEC 27017:2015 Information Technology – Security Techniques – Code Of Practice For Information Security Controls Based On ISO/IEC 27002 For Cloud Services, and
- CDMC’s Best Practices for Managing Data in the Cloud
2. Violate cloud/data engineering best practice: They are in conflict with the benefits and goals of moving to a modern data architecture
Let’s look closer at these violations and the security issues they create.
BI Extracts Violate Modern Data Security
The shift to the cloud has changed how we need to think about data security. No longer do apps sit between data and users; the need for more users to have direct access to data has never been higher, and it’s powered by data being the primary driver for the success of your business. Modern security practitioners have taken notice, and changes to global security standards and guidelines have reflected this shift. Adopting these standards allows your business to shift to modern data engineering best practices and accelerates data-driven initiatives.
We will first focus on how BI extracts violate modern data security. To do so, we’ll ground ourselves in a strong understanding of the latest data security guidelines recommended by NIST, ISO, and CDMC.
Key guidelines of NIST Zero Trust (ZT) require that you:
- Have a detailed inventory of all data resources and actors across the enterprise in conjunction with business processes to assess risk and understand where to enforce ZT.
- Ensure policy decisions and enforcement are as close as possible to the resource and continually evaluate access using dynamic policy.
- Not assume authentication and authorization to one resource will automatically grant access to a different resource, and that access control enforcement is as granular as possible.
Key guidelines of ISO 27017 include:
- Art 8 Asset Management, which requires the organization to have an inventory of information assets, or data sets, stored in the cloud (8.1.1). These data sets need to be labeled (8.2.2) and have owners (8.1.2).
- Art 9 Access Controls, which requires that the organization manages access controls at the level of the data set (9.4.1). It also refers to ISO 27040, which states that the organization needs to employ access controls that guard against unauthorized access from other cloud service users (tenants) while providing appropriate access privileges to users permitted to access the data.
Key guidelines of CDMC suggest that you:
- Exploit opportunities for automation in the cloud environment to support governance of data consumption.
- Ensure that the roles and responsibilities of data owners extend to data in cloud environments, and that data has labeled classifications for information sensitivity.
- Migrate access controls from application-centric entitlements to data-centric entitlements through automatic enforcement of metadata policies such as data access controls across multiple platforms and applications.
As you can see, the guidelines and recommendations across all three security standards are quite consistent: you must inventory your data, apply policy as closely to the data as possible, and evaluate access to the data per user granularly at the data tier.
To understand how this works in practice, consider the below diagram provided by NIST:
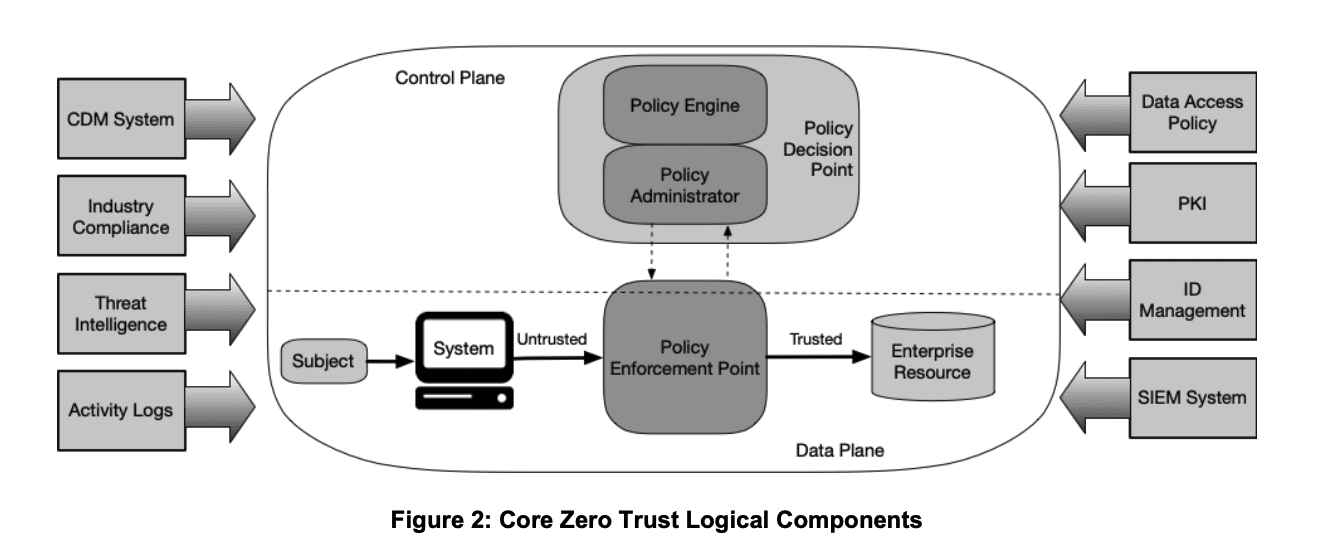
The dynamic policy decision – powered by rules and metadata about your inventoried and owned subject and resource – is evaluated in real time by the policy decision point (PDP) to determine if the Subject should be trusted with the Enterprise Resource in question. The policy enforcement point (PEP) then will enforce that decision against the Subject.
This is what a data security platform such as Immuta provides. It abstracts policy logic from your database (PDP), yet orchestrates dynamic controls – the output of those policy definitions – native to your database (PEP). This moves policy as close as possible to the data and constantly evaluates access per-user, without altering data consumer access patterns. It also allows federated ownership of data and subsequent policies.
Understanding this guidance, let’s now dive into how BI extracts violate data security (if it wasn’t already obvious):
Security Issue 1: Analysts now own “Resources” created out of thin air
As we learned, the organization must have detailed knowledge of all data resources, users, and business processes in order to accurately enforce security. For example, you would do a great deal of work to understand your data inventory in Snowflake, and build policy as close to the data as possible. But now, when a user creates an extract, it pulls all that data out and creates a new copy of it in your BI tool to improve performance (in theory). This extract is a new “Enterprise Resource” that must be considered against security policy, and you are relying on the BI analysts to secure it appropriately, on their own, when they create it. Note that when using tools like Tableau and Power BI Desktop, that data is also landing on their laptops.
Said another way, what if your data platform team told the security team: “we’re going to let everyone create their own Snowflake accounts, copy all our data into it, and then manage permissions to that data for all the other analysts – on their own.” Security would think they were crazy – and they are. But this is exactly what you are doing when you allow extracts to your BI tool.
Is Security aware this is happening with BI tools and that it’s breaking their security posture? At a minimum, resolving this would require constant re-evaluation of your Enterprise Resources (every extract) by the data owners, which is not feasible because they are created in an ad hoc manner.
Security Issue 2: The policy is not as close as possible to the data
Copies of your data are being created through these extracts, and each copy only reflects the access policies applied to the user that created it. But that user is now going to share their copy around through a dashboard to other users who may require different and more restrictive access.
You cannot rely on ad hoc policy definition created post-extract in only the BI tool. Data access policy needs to be defined through a consistent framework and live at the data tier, where each user is evaluated for access and the appropriate data exposed, no matter the tool being used. Violation of foundational guideline 2 – the data policy must live as close to the data as possible – is the largest risk for an organization with extracts.
Security Issue 3: Policy is not dynamic
While BI tools like Tableau and PowerBI do have some fine-grained access control capabilities, they are minimally API accessible (can’t PDP them), the policies are precomputed as part of the extract (not dynamic), and for the most part, they are extremely coarse with lack of PEP primitives. Because of this, they cannot act as a PEP, nor can they be integrated with a PDP, which violates the third goal of evaluating access dynamically per user.
BI Extracts Violate Modern Cloud/Data Engineering Best Practice
At this point you are probably saying, “But I can’t sacrifice dashboard performance for security, so how do I continue to get the performance I need in the BI dashboards, while maintaining the security I need”? The answer is: You can! This is why you moved to a modern cloud data architecture.
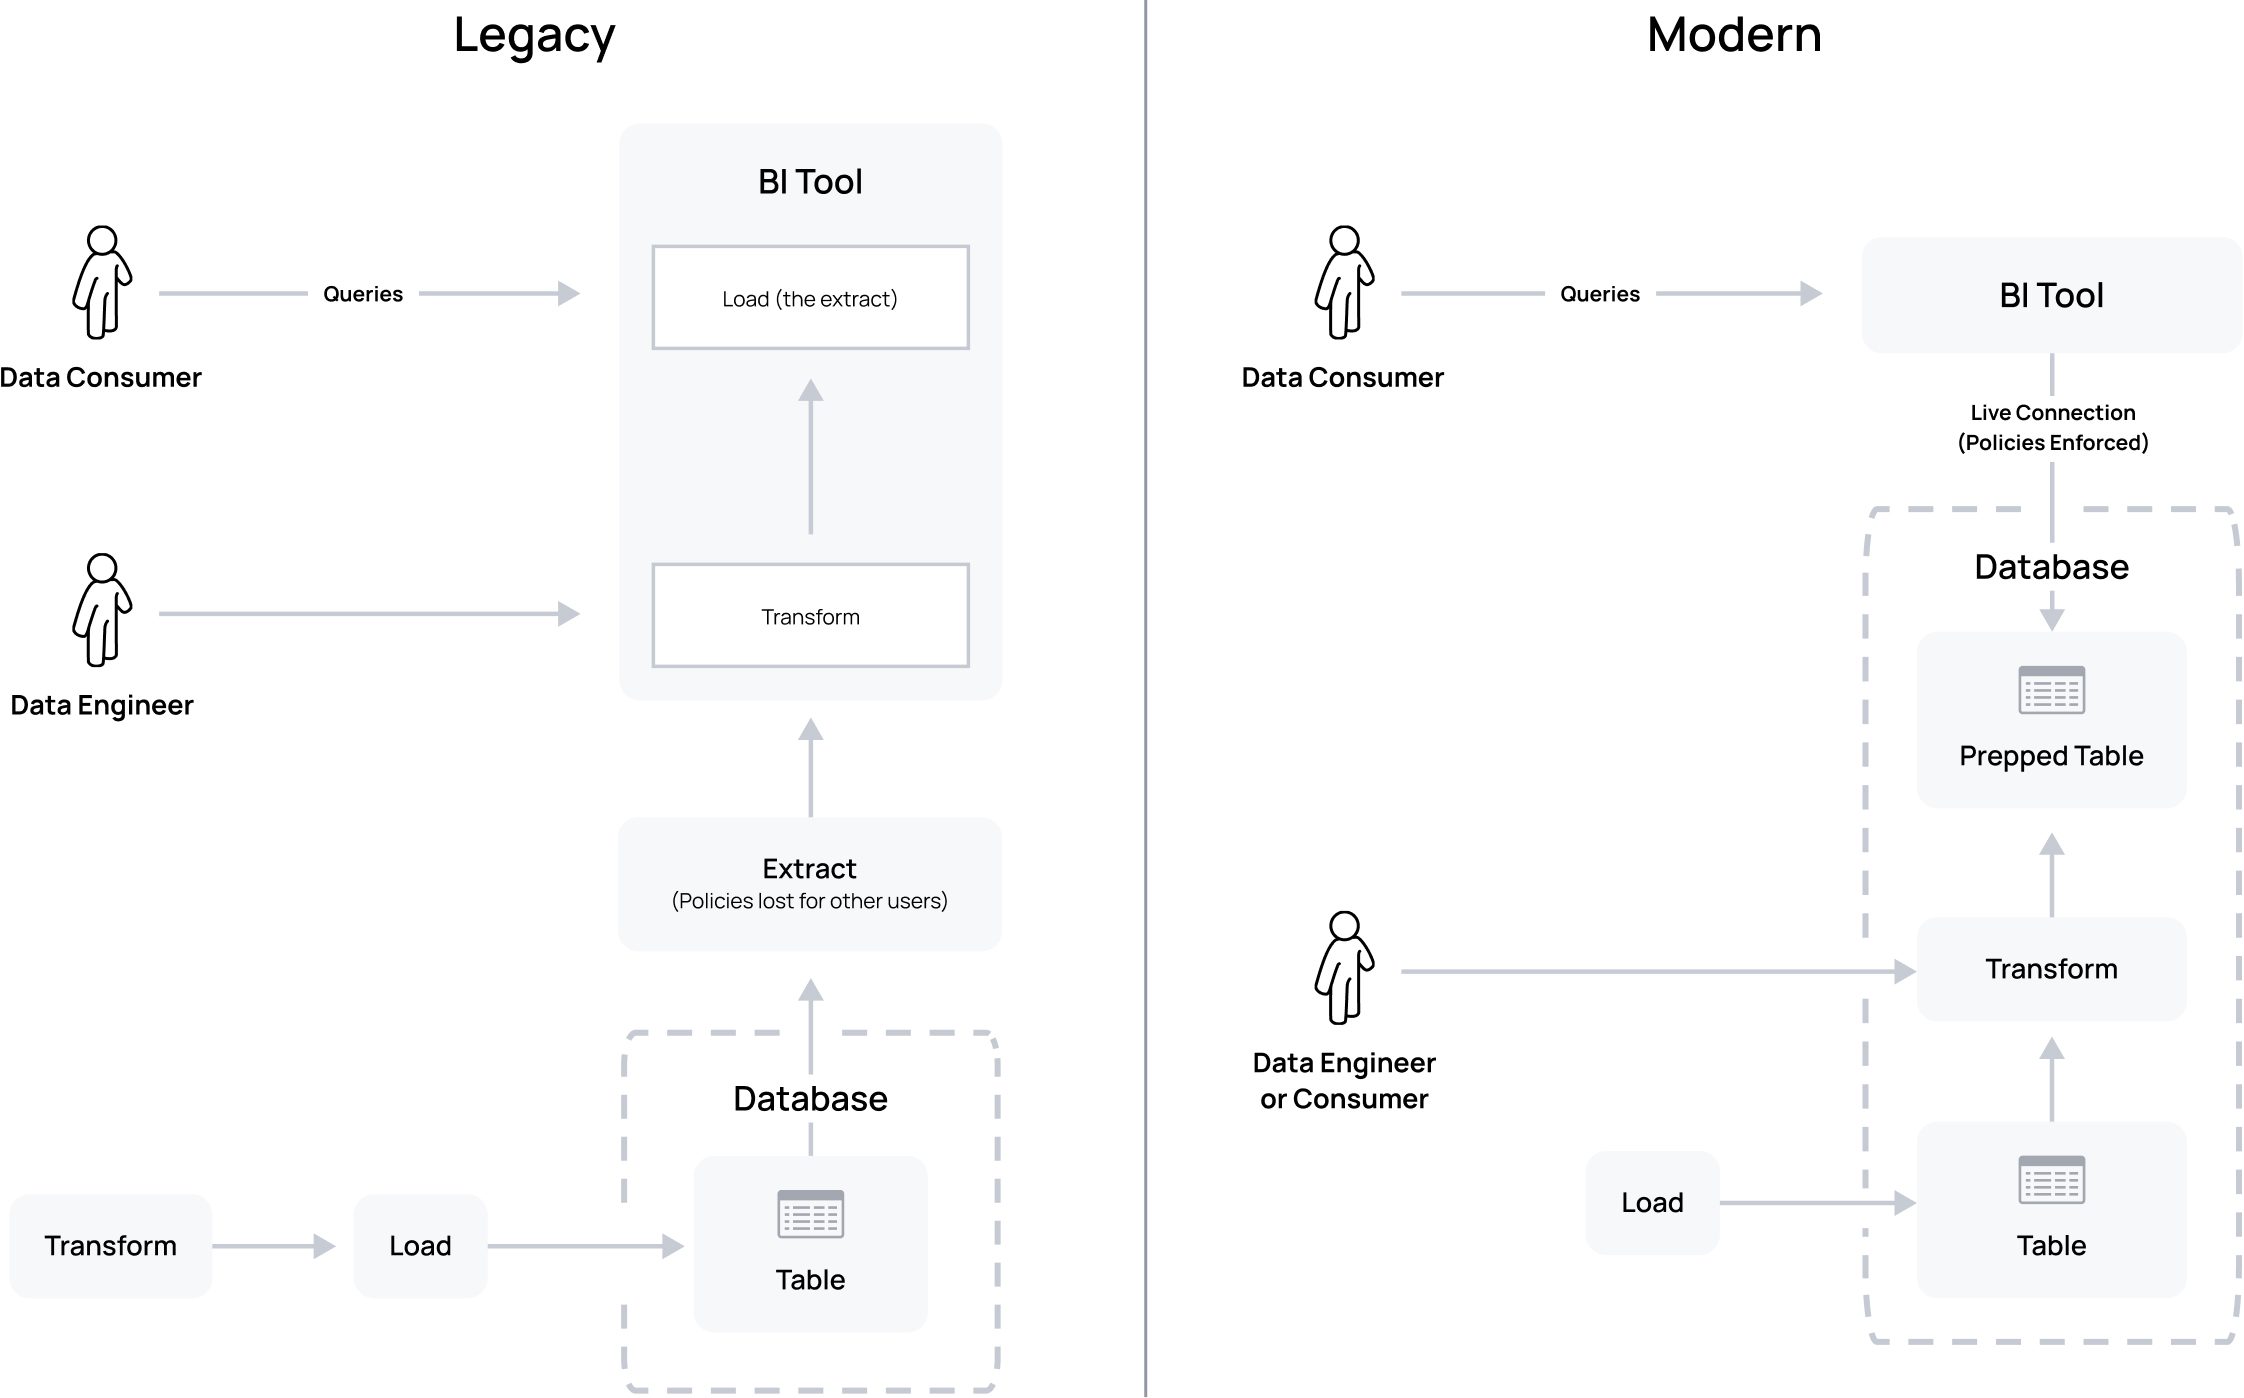
In a pre-cloud world, it was always ETL. The T (transform) had to come before the L (load) because your database was very expensive and was mostly allocated for servicing queries, not data engineering. Now, with nearly limitless compute, cheap storage, and modern data security, the T can move AFTER the L, which opens a new world of powerful data engineering in-database and brings it close to where the data resides. This innovation has created the rise of incredible tools like dbt, whose purpose in life is to manage transforms at the data tier: “With dbt, data teams work directly within the warehouse to produce trusted datasets for reporting, ML modeling, and operational workflows.”
So why are we talking about cloud data warehouses creating the rise of ELT? Because BI extracts are a legacy approach for placing an additional – and needed – T after legacy ETL (ETL-T). This approach came well before the ELT paradigm shift. It also came before modern cloud data security best practices, with its granular, user-driven, and dynamically evaluated policy; without it, there was severely reduced access to data in its rawest forms at the data tier.
Consider what an extract actually is: the extract is the result of the user doing needed data engineering/transforms in the BI tool, turning the extract into a table with all the precomputed results for consumption by a dashboard. This is exactly the motivation of transform-tools-at-the-data-tier, like dbt.
The point: if you are using extracts, you aren’t using your cloud data warehouse as intended. Not only are you breaking modern cloud data security, but you are breaking modern data stack data engineering best practices, which will cripple your data-driven business goals. Instead, data engineers and your dashboard builders should do transforms in the warehouse rather than the BI tool. There, they can compute incrementally updated tables and materialized views to service BI dashboards that will have superior maintenance, scaling, and performance characteristics to an extract, without breaking security.
In fact, recent guidance from Snowflake regarding Power BI states exactly this:
Additionally, it provides several other advantages that are lost if doing the transforms in your BI tool, specifically:
- Scalability: Avoids data size and file type limits imposed by BI tool extracts
- Reusability: Reuses transformed, BI tool-ready, tables/views across dashboard creators
- Reduced latency: Keeps the data up-to-date more easily and quickly, versus periodically refreshing extracts
- Recreation of historical transformations: Easily rebuilds modeled data from source data
- Traceability of data model dependencies: Inspects which lower-level data models rolled up to a given fact or dimension model
- QA of test analytics code changes: Ensures that changes being pushed to transformation code won’t introduce data quality issues
- Consistency: Report on trusted metrics rather than creating your own ad-hoc/isolated definitions (semantic layer)
Once those optimized tables are created through transforms and are ready for dashboard consumption, you must have all dashboards consume the data using a “live connection.” This must be done by the real consuming user* (not a service account), to the already policy-protected optimized table/materialized view, where per-user access is constantly evaluated by your PDP.
Putting it to the Test
In order to prove that running transforms in-database has better performance than extracts, we can use the tried and true TPC-DS performance benchmark. “The TPC-DS benchmark provides a representative evaluation of performance as a general purpose decision support system”. In other words, TPC-DS provides a set of data and realistic analytical queries representative of what one would use in real life in a BI dashboard. This also means the following test is fully reproducible.
Test Parameters:
TPC-DS has 99 queries for testing performance; for this particular test, we chose TPC-DS query 18 because it is one of the typically slower performing queries. This is query 18 described in plain language:
“Compute, for each county, the average quantity, list price, coupon amount, sales price, net profit, age, and number of dependents for all items purchased through catalog sales in a given year by customers who were born in a given list of six months and living in a given list of seven states and who also belong to a given gender and education demographic”.
The data is made up of:
| TABLE | SIZE IN ROWS |
|---|---|
| CATALOG_SALES | 1,439,980,416 |
| CUSTOMER_DEMOGRAPHICS | 1,920,800 |
| CUSTOMER | 12,000,000 |
| CUSTOMER_ADDRESS | 6,000,000 |
| DATE_DIM | 73,049 |
| ITEM | 300,000 |
The database used was Snowflake with an X-Small warehouse, but this test would show similar results in systems such as Databricks, Redshift, BigQuery, etc.
Finally, this is the raw TPC-DS Query 18:
SELECT i_item_id,
ca_country,
ca_state,
ca_county,
...
FROM catalog_sales,
customer_demographics cd1,
customer_demographics cd2,
customer,
customer_address,
date_dim,
item
WHERE cs_sold_date_sk = d_date_sk
AND cs_item_sk = i_item_sk
AND cs_bill_cdemo_sk = cd1.cd_demo_sk
AND cs_bill_customer_sk = c_customer_sk
AND cd1.cd_gender = 'F'
AND cd1.cd_education_status = 'Secondary'
AND c_current_cdemo_sk = cd2.cd_demo_sk
AND c_current_addr_sk = ca_address_sk
AND c_birth_month IN ( 8, 4, 2, 5,
11, 9 )
AND d_year = 2001
AND ca_state IN ( 'KS', 'IA', 'AL', 'UT',
'VA', 'NC', 'TX' )
GROUP BY rollup ( i_item_id, ca_country, ca_state, ca_county )
ORDER BY ca_country,
ca_state,
ca_county,
i_item_id
LIMIT 100;
Test Steps:
In Tableau, your first step is to set up your “Data Source,” which eventually would become the extract, and then present that extract to create the visualization. If we go back to our plain language representation of the query, you can think of this as what you want to visualize versus what you are looking within:
“Compute, for each county, the average quantity, list price, coupon amount, sales price, net profit, age, and number of dependents for all items purchased through catalog sales in a given year by customers who were born in a given list of six months and living in a given list of seven states and who also belong to a given gender and education demographic”
What you are looking within is the “Data Source”, which is what is contained in your extract (or, as we’ll contrast later, what is transformed into a table/materialized view in your database).
Creating the extract for query 18 in Tableau would look like this:

Notice we left off the “given list of 6 months” from the filter because the Tableau user interface filter did not support an IN filter for a numeric column, only ranges. For the purposes of this test, that is fine as long as we also leave it out in the transformed table to which we are comparing performance.
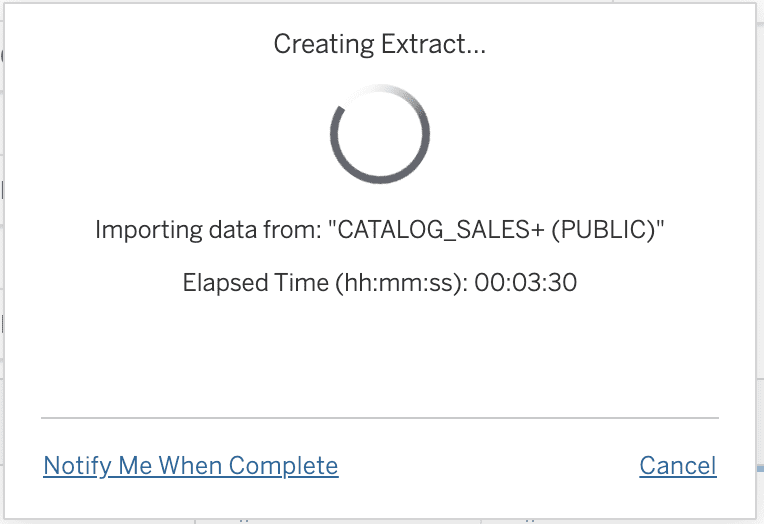
As you can see, with Tableau it is possible to use the joins and filters defined in the graphical interface in order to create a much more limited extract of only the data that is actually needed (4,807,313 rows instead of all 1,460,274,265 rows!). Execution of this Tableau extract took more than three minutes to generate using the X-Small Snowflake warehouse.
Waiting for the extract to finish in Tableau:
Similarly, we are going to want to limit the Power BI Import to only the data we need or it will be entirely too large. To accomplish this with Power BI there is no graphical interface; you instead specify custom SQL as part of the import process. This custom SQL represents the same “What you are looking within” as we defined with the Tableau graphical user interface:
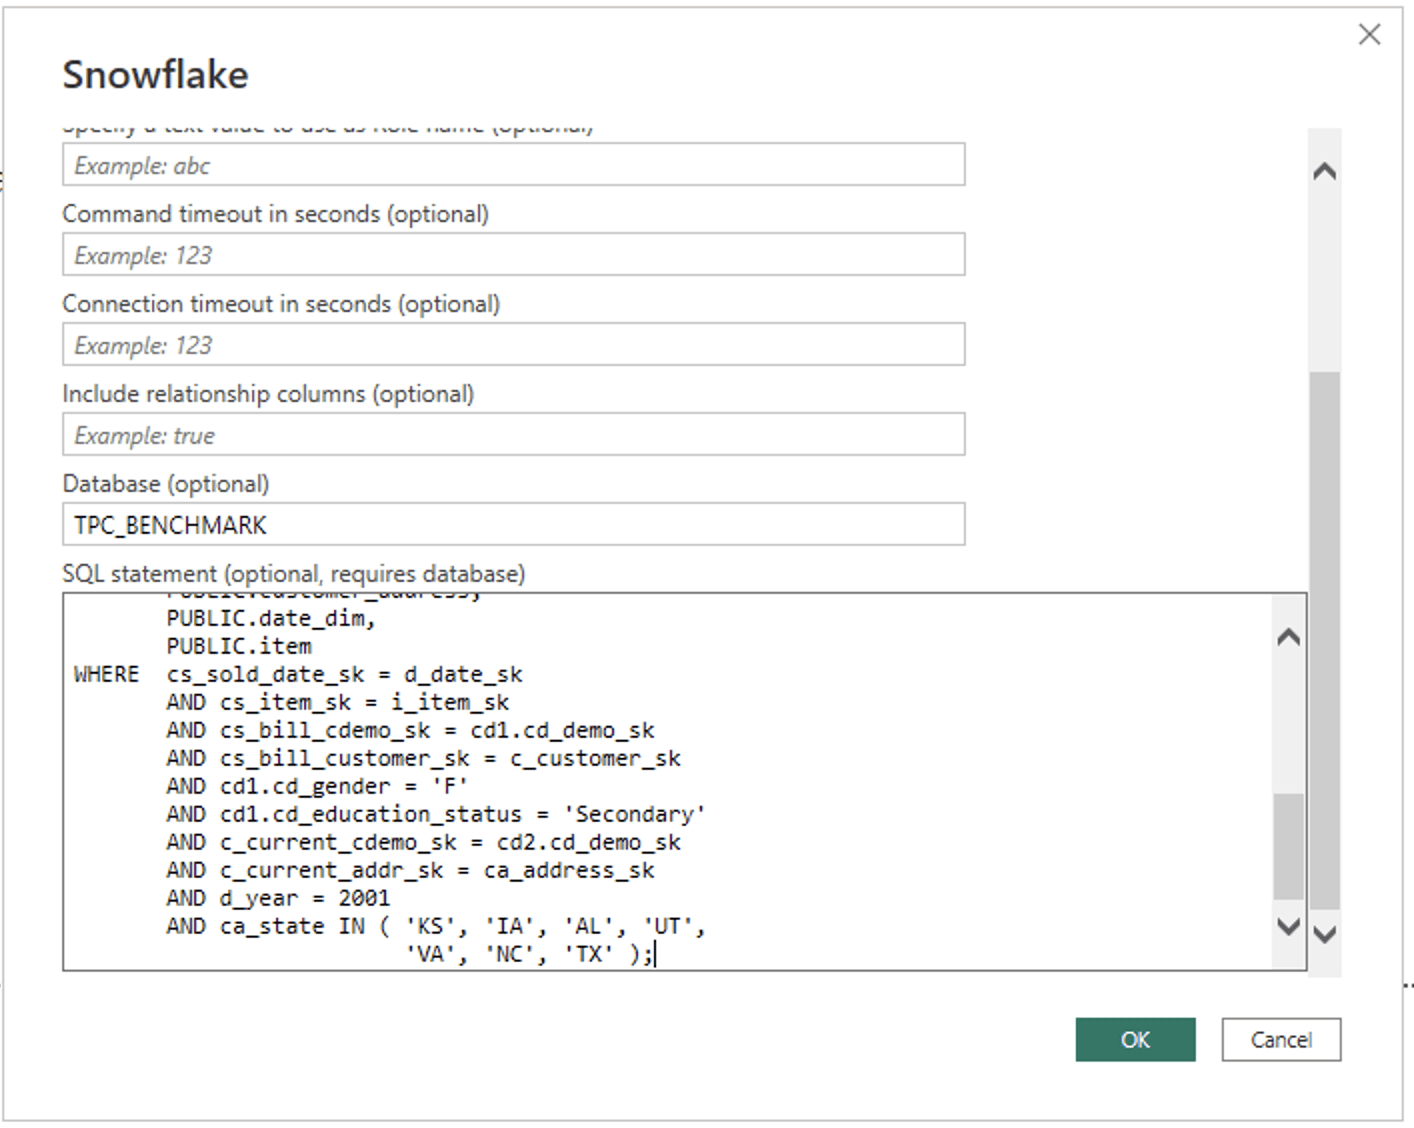
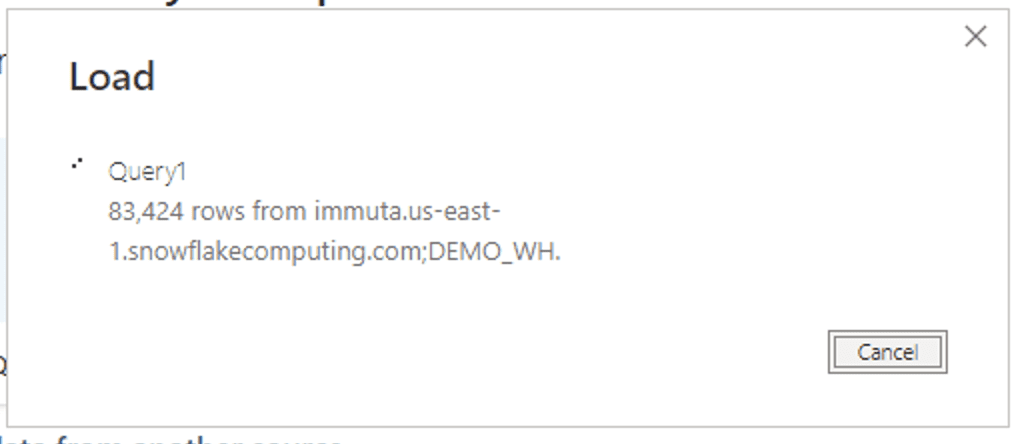
Similar to Tableau, this Power BI Import took more than three minutes with the Snowflake X-Small warehouse.
Waiting for the Import to finish in Power BI:
It’s worth mentioning that if you are using Tableau or Power BI desktop, that means this data is being copied to local laptops – another security consideration.
Instead of building the extract in Tableau or doing the Import in Power BI, the correct approach is to pre-compute the same “Data Source” as a table in your database via a transform like the below SQL statement, noting this is the exact same SQL we used to create the Power BI Import, minus the CREATE TABLE part:
CREATE TABLE [database].[schema].tpc_query_18 as (
SELECT i_item_id,
ca_country,
ca_state,
ca_county,
cs_quantity,
cs_list_price,
cs_coupon_amt,
cs_sales_price,
cs_net_profit,
c_birth_year,
cd1.cd_dep_count
FROM catalog_sales,
customer_demographics cd1,
customer_demographics cd2,
customer,
customer_address,
date_dim,
item
WHERE cs_sold_date_sk = d_date_sk
AND cs_item_sk = i_item_sk
AND cs_bill_cdemo_sk = cd1.cd_demo_sk
AND cs_bill_customer_sk = c_customer_sk
AND cd1.cd_gender = 'F'
AND cd1.cd_education_status = 'Secondary'
AND c_current_cdemo_sk = cd2.cd_demo_sk
AND c_current_addr_sk = ca_address_sk
--AND c_birth_month IN ( 8, 4, 2, 5, 11, 9 ) commented out
AND d_year = 2001
AND ca_state IN ( 'KS', 'IA', 'AL', 'UT',
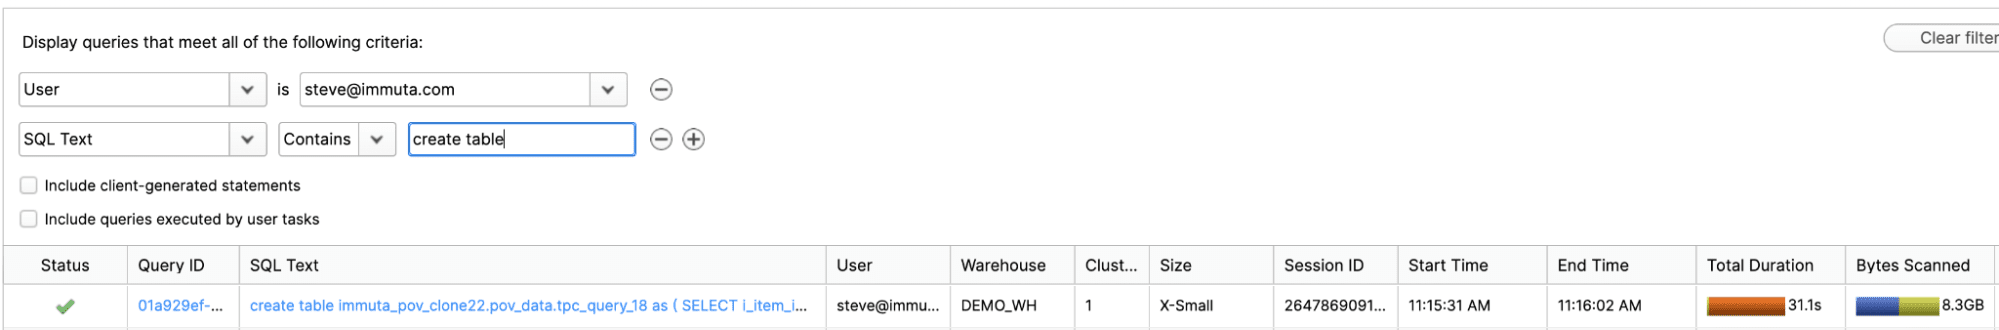
'VA', 'NC', 'TX' )); This transform can be managed by any transform tool like dbt, and incrementally updated on a schedule within your database with no data size restrictions. This took Snowflake 31.1 seconds to process and is native to your database (remember, Tableau and Power BI took over three minutes):
Transform execution time in Snowflake:
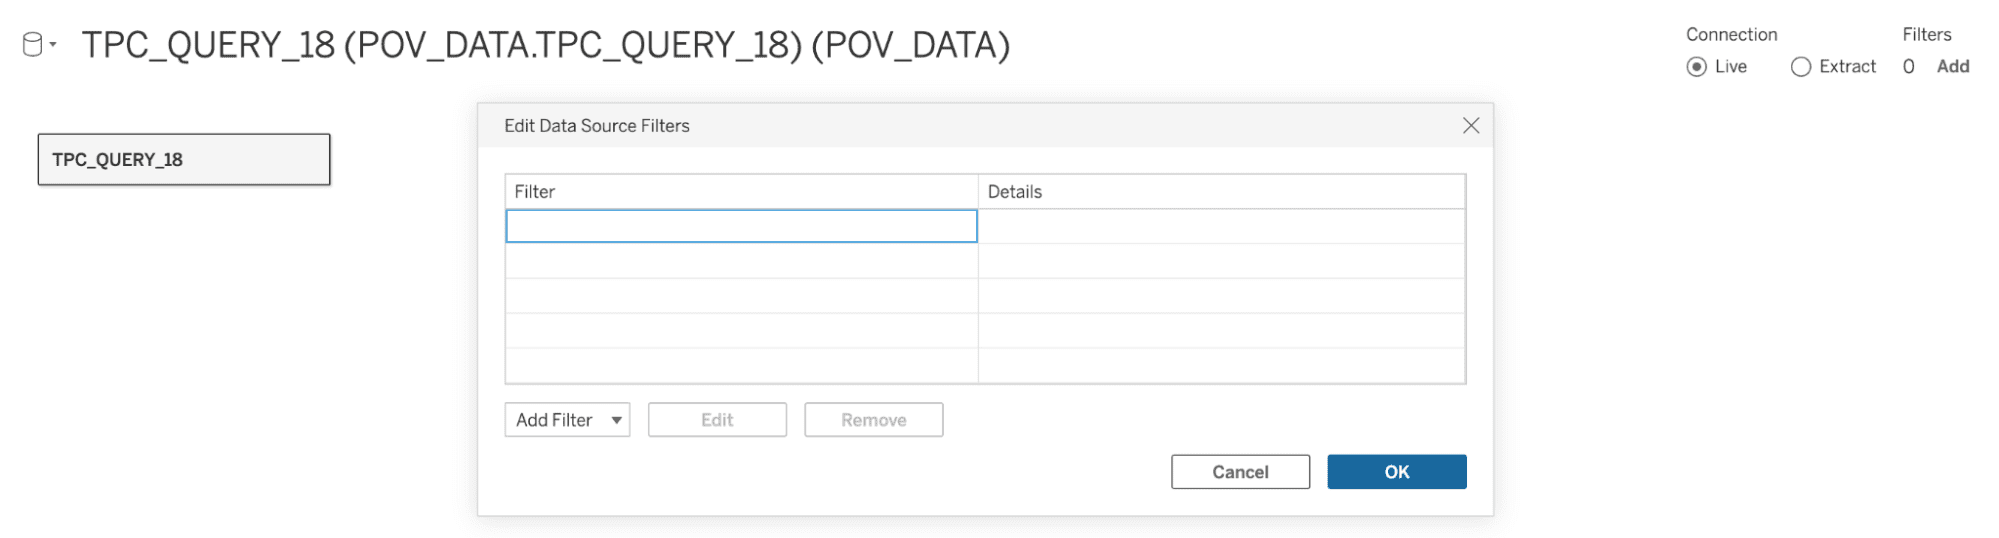
Now, the Tableau user building the dashboard can simply point to this single table that was created as their “Data Source” with a Live connection:
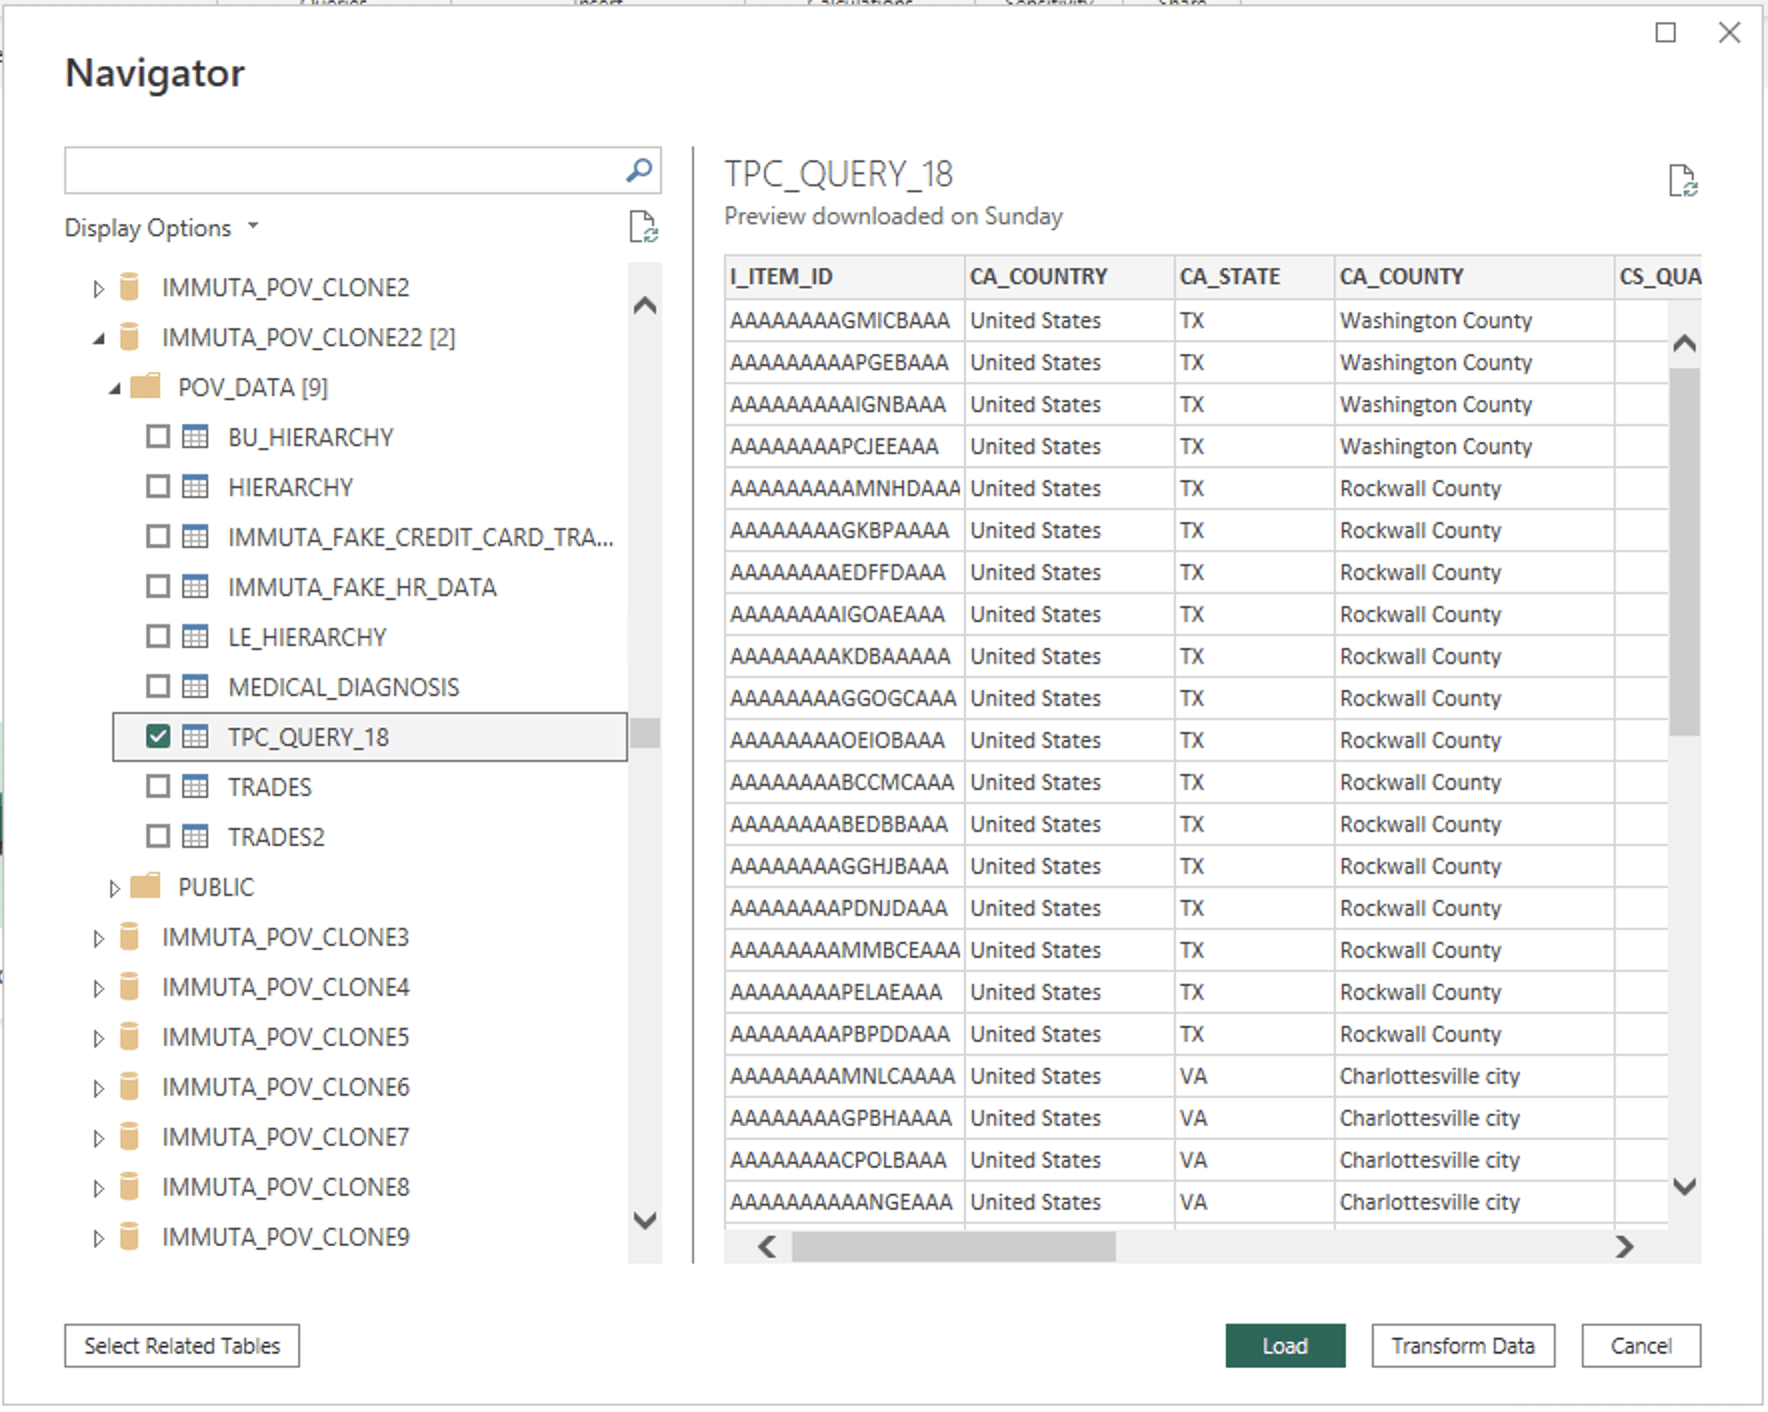
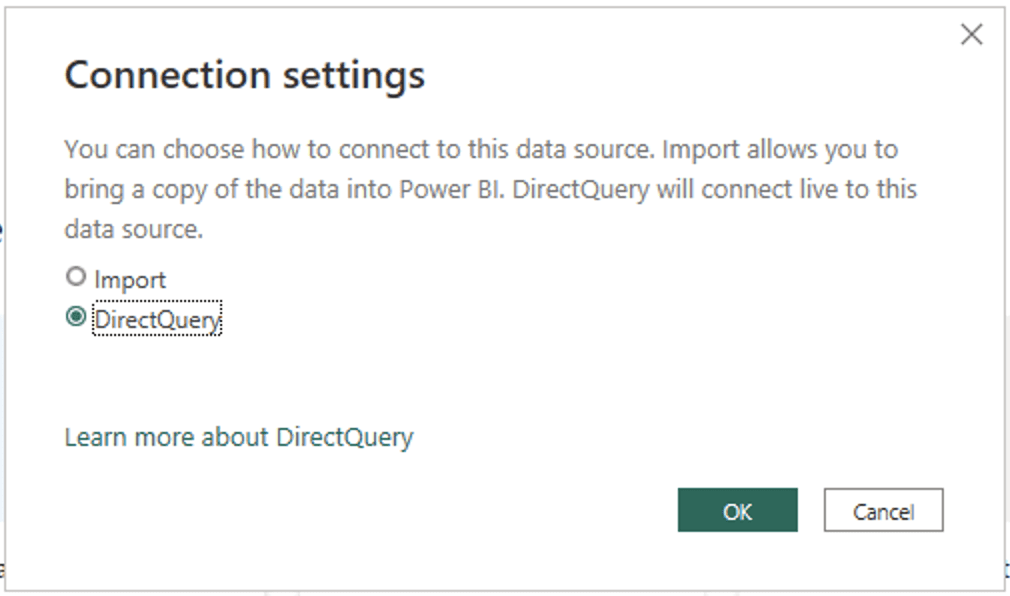
Similarly, the user building the Power BI dashboard can simply point Power BI to the table we created in Snowflake and set it as a live connection with “DirectQuery”:
Maintaining this transformed table in Snowflake makes it easily reusable by future dashboard authors, maintainable, and source controllable to avoid data quality issues. Conversely, allowing dashboard authors to manually manage extracts is fragile, error-prone, and can make it impossible to retroactively fix data quality issues. Note, we aren’t implying that a different user should create these tables/views in-database (although they could) because remember, due to our modern data security best practices, you can open raw access to your data for data engineering to your dashboard builders – and you should, because it reduces security risks significantly, as discussed above.
But are the Tableau extract and Power BI Import actually faster? Let’s find out!
From the actual dashboard perspective, you can see that they look exactly the same – we are computing the averages across the dimensions prescribed by the TPC-DS query 18. We also filtered by Country: United States, State: KS, and County: Neosho, rather than “limit 100” like the TPC query specified, just to make this dashboard even more realistic.
Tableau dashboard using the extract:

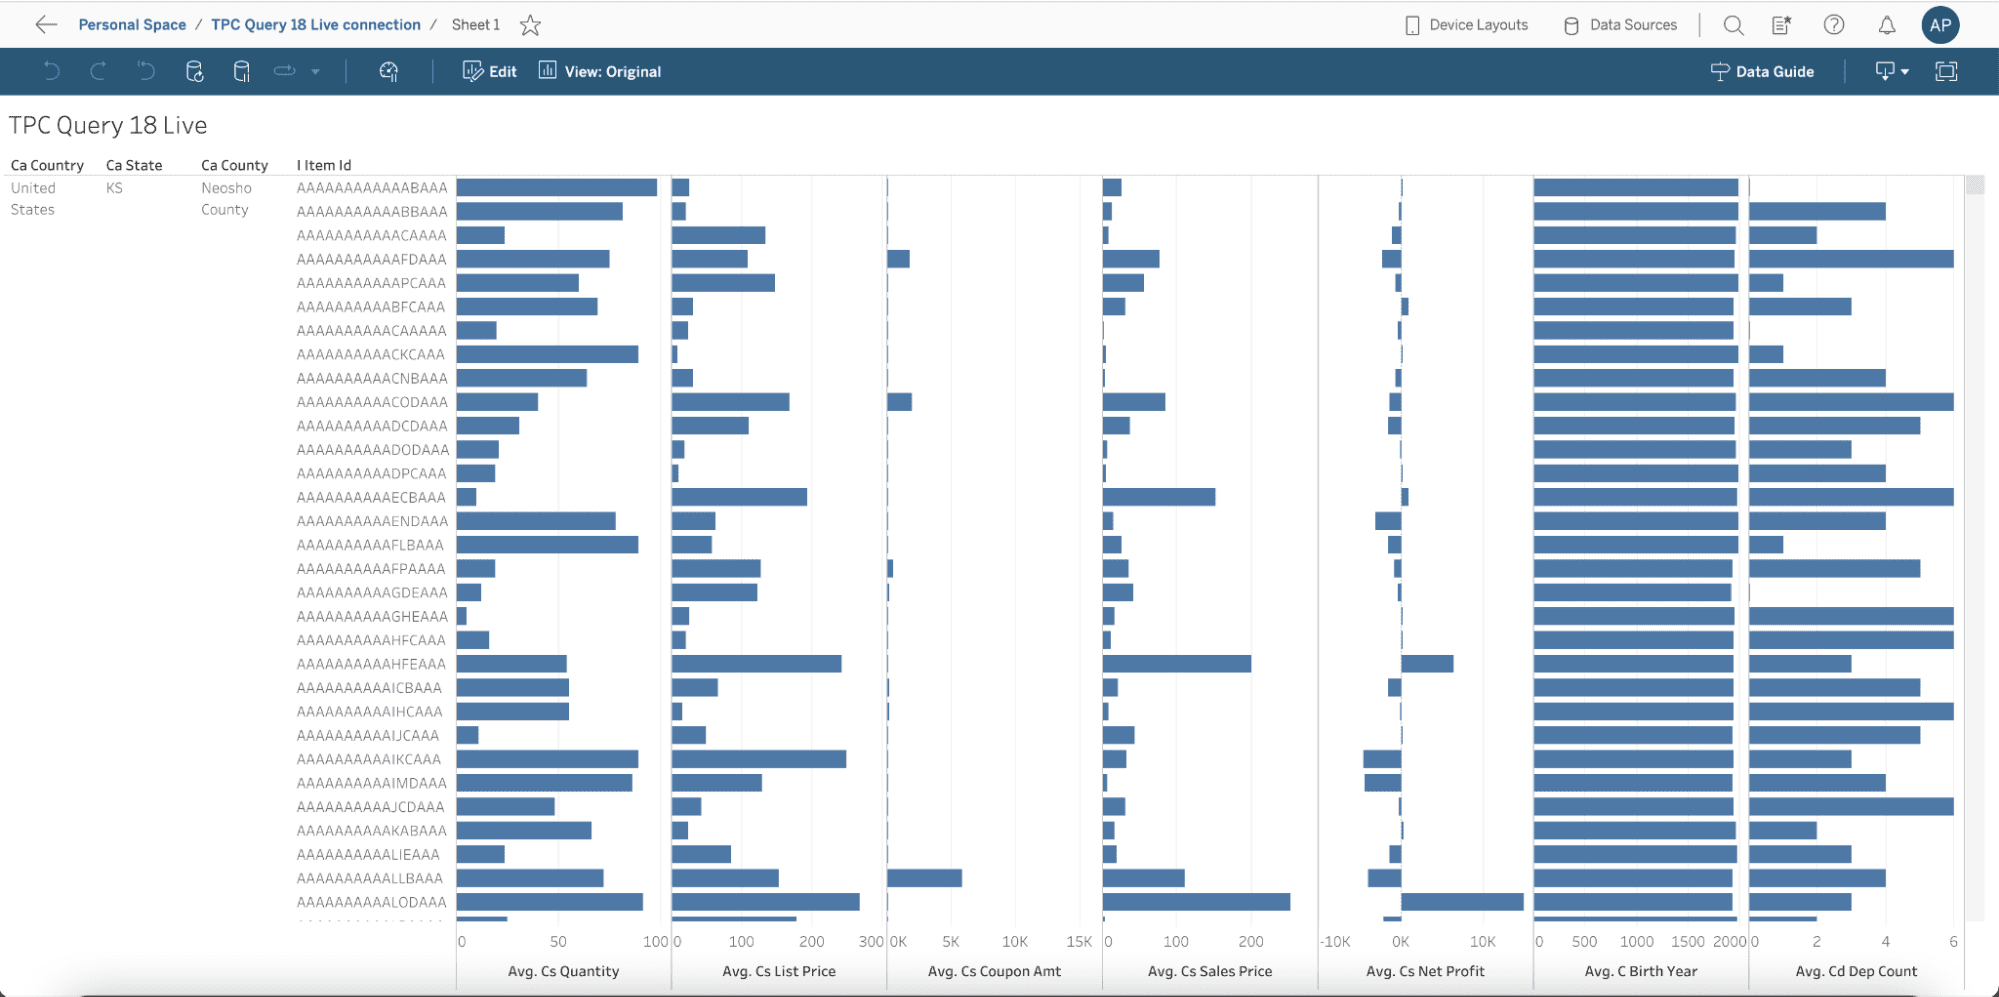
Tableau dashboard using the live connection to the table created in-database:
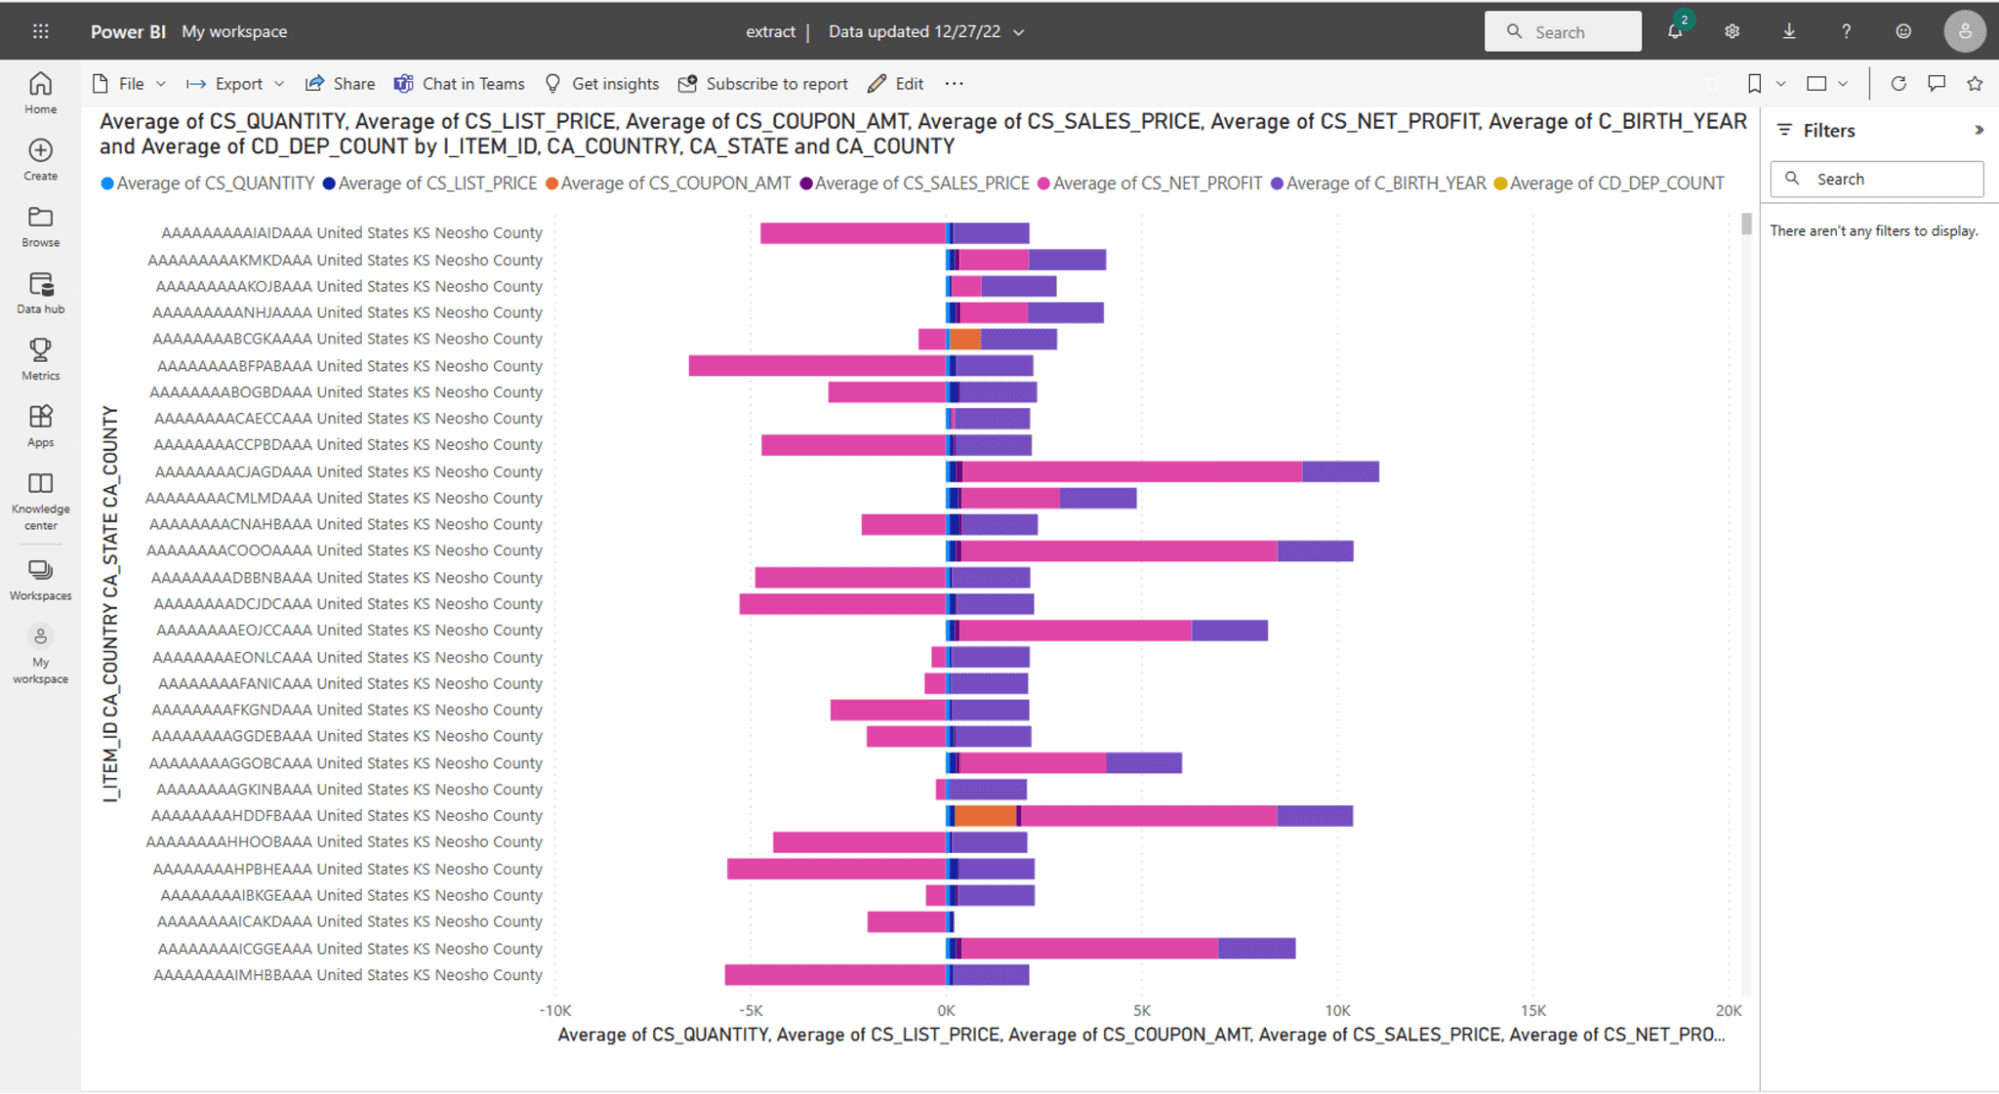
Power BI dashboard using Import Mode:
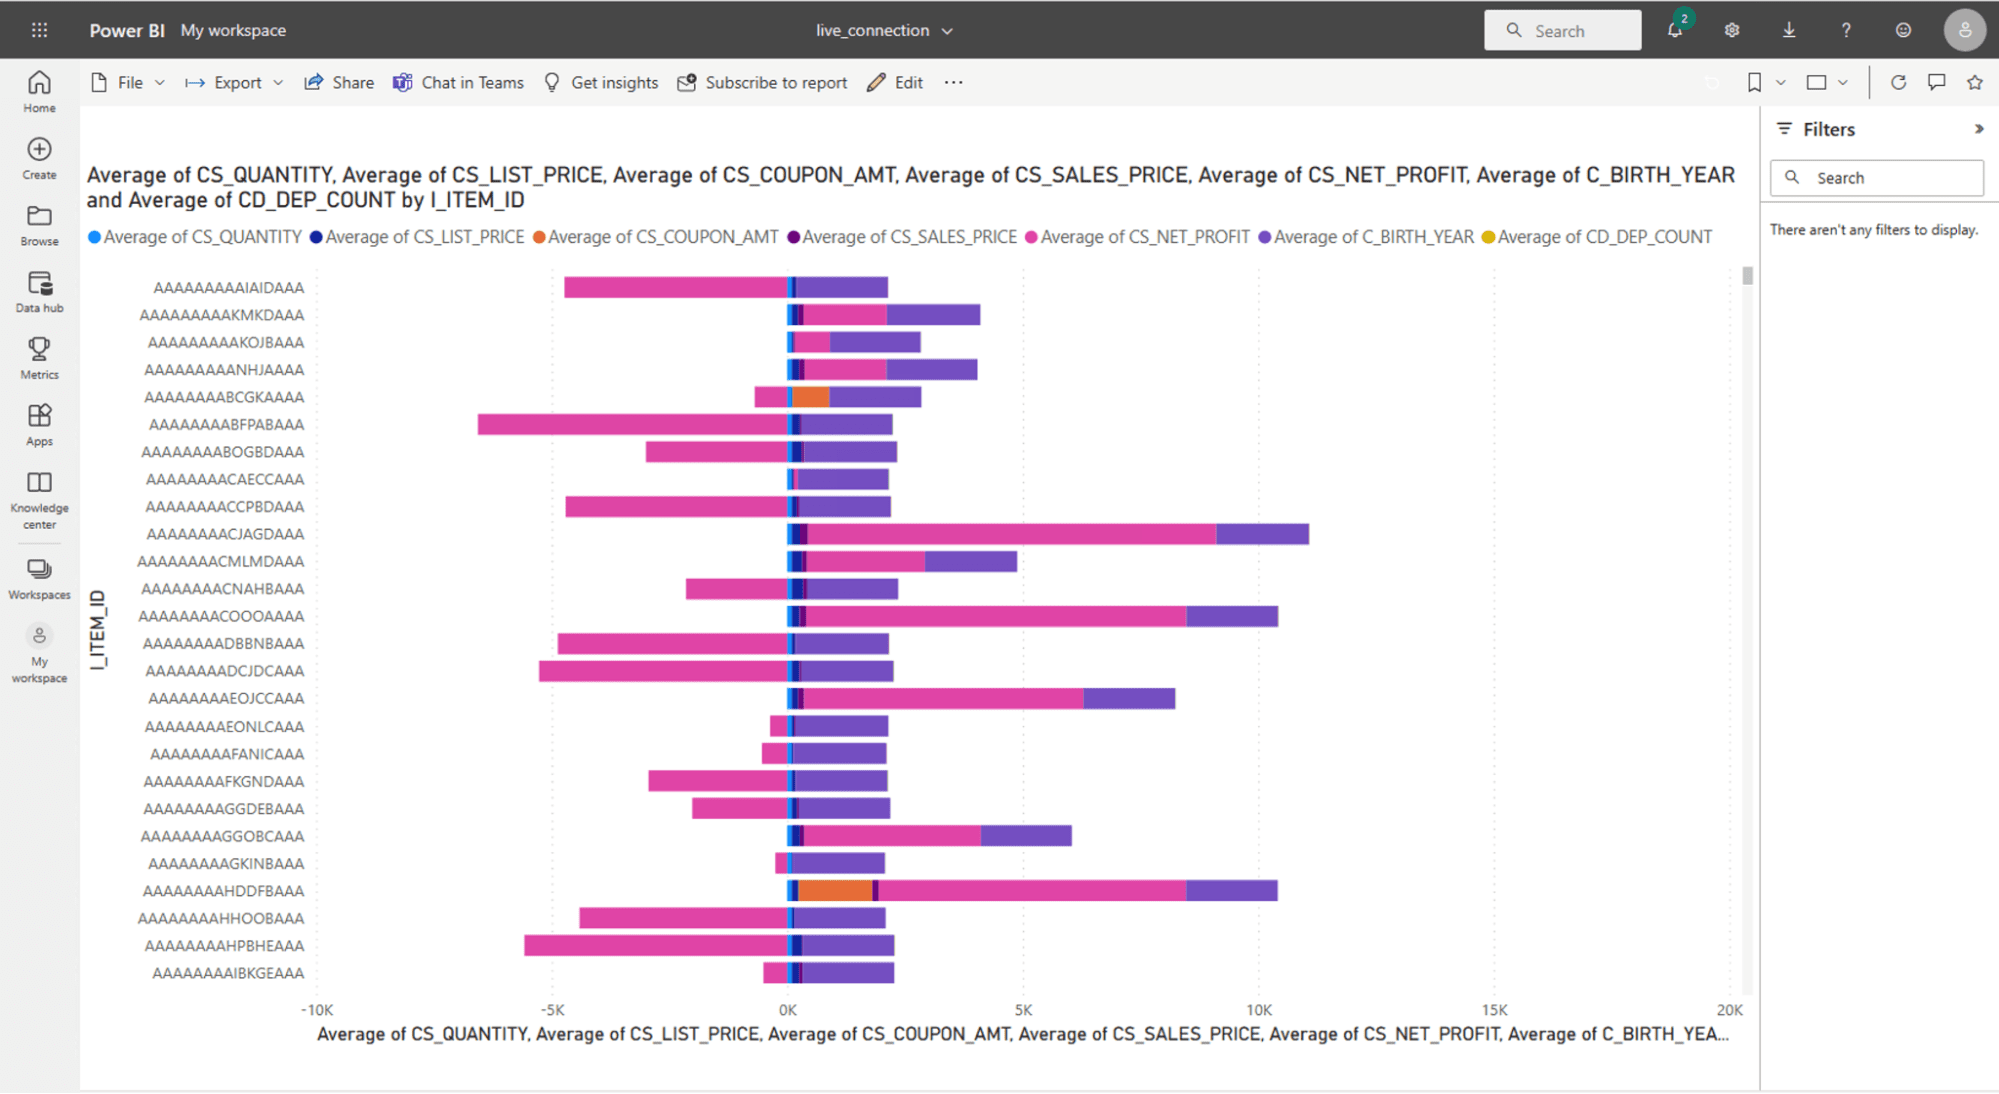
Power BI dashboard with a live connection (DirectQuery) to the table created in-database:
Any difference in performance on dashboard refresh was negligible because they all refresh in three seconds or so. And while altering the filters and visualizations for the dashboard, they all responded equally in both tools – regardless of extract or live connection, there was no performance difference. However, remember that in the extract mode, you are seeing a static snapshot of the data and you must refresh it to the BI tool for an up-to-date view of your data, which, as we mentioned above, takes over three minutes (and will continue to increase as you add more rows). With the live connection, the incremental updates are happening in-database, using scalable database compute with no need to regenerate extracts. As we saw above, this happens more than six times faster.
Why is dashboard performance equivalent if both Tableau and Power BI claim extracts improve overall performance? They aren’t lying, but their statements assume all data transformations are happening in each of their respective tools. This is because doing “T” in-database wasn’t feasible when these solutions were conceived, nor were cloud data security best practices – now they are.
Had we instead pointed the live connection from Tableau and Power BI to the raw, unjoined, unfiltered six TPC-DS tables used by query 18, the live connection dashboards would have been MUCH slower because they would have taken on that same three minute overhead of generating the extract, but for every query (we can’t even test this because the import of the extract is too big). Instead, we created and managed the pre-joined and pre-filtered “extract” in Snowflake (or any other cloud data warehouse), and pointed the BI tool to that, which eliminates any performance benefit of using the extracts in-BI tool.
Now, when this dashboard is shared, you can ensure a live connection is used for each user* so policies can be enforced. For example, since all aggregation happens at the dashboard tier, if there’s a row-level security policy hiding rows (maybe they are only allowed to see data from the state where they work), the dashboard will render correctly with all enforced policies because policy logic occurs at the data tier using the PDP/PEP. Conversely, if using the extract approach, you would also break your security model because the “Data Source” extract will only enforce the policy for the user that created the extract – and because of that, all subsequent users will see what that user can see.
Conclusion
In summary, in order to abide by modern cloud security standards and guidelines, you should:
- inventory your data,
- apply policy as closely to the data as possible, and
- evaluate access to the data per user granularly at the data tier
This should be done using a tool like Immuta, which can act as a PDP to orchestrate PEPs across all your data platforms consistently, as well as at the data tier. The Immuta PDP will constantly evaluate user access and enforce granular controls based on those decisions using the data-tier PEP.
Once that is established, you must stop bypassing the data-tier policy controls through the use of BI extracts. Instead, you should shift to the modern data engineering paradigm of transforms at the data tier. There are many benefits to this paradigm shift. Most importantly, the data-tier security continues to function as intended, and dashboard creators are empowered with raw data access in-database. Then, BI dashboard connections must be “live” per-user from the BI tool. As we proved, the dashboards will perform well because they are pointed to optimized tables and/or materialized views created through database-level transforms, and policy will be enforced through the data-tier PEP orchestrated by the PDP.
Taking this approach provides the best of both worlds: modern cloud security and the modern data engineering best practices of scalability, security, and reproducibility.
*It may at first not be obvious how to enable this, but between techniques like “prompt user” for Tableau or PowerBI dashboard SSO for Snowflake, Azure Databricks, Redshift, BigQuery, and Starburst, it is possible.
Try it yourself
See how to modernize your data approach.